
Thai Agriculture 2026 Outlook: 52 Billion USD Opportunity and Action Plan for Farmers
Summary from Thailand Agriculture Industry Guide 2026 by Iconic Research — Thai agriculture grew 6% to 52 billion USD, but faces challenges of market concentration, drought, and technology transition
Thai agriculture exports reached 52.2 billion USD in 2024 (+6.0%) — exceeding 50 billion for the first time. But beneath these impressive numbers lies a concerning vulnerability: 5 major products account for 87.7% of all agricultural exports, and 3 countries (China, USA, Japan) buy 44% of everything.
“Thai agricultural success isn’t measured by how much we export, but by how diverse and sustainable we are.” — Iconic Research
This report synthesizes key insights from the Thailand Agriculture Industry Guide 2026 by Iconic Research and translates them into actionable language for Thai farmers and entrepreneurs, with a concrete action plan that KoMoMi can help implement.
📄 Download the Full Research Report
For those who want to read the original full report with detailed statistics and comparison tables:
⬇️ Download PDF: Thailand Agriculture Industry Report
File size: ~115 KB · Format: PDF · Language: English · Compiled by: Iconic Research
Thailand Agriculture Industry Overview 2026
GDP vs Exports: A Revealing Truth
| Indicator | Share |
|---|---|
| Agriculture GDP | 9% (2023) |
| Total Exports | USD 300.5 billion (+5.4%) |
| Agricultural + Agro-industrial Exports | USD 52.2 billion (+6.0%) |
| Agricultural export share of total | 17.3% |
This means: Agriculture accounts for only 9% of GDP but generates 17.3% of export revenue — a far more important foreign exchange earner than its GDP share suggests.
Top 5 Revenue Generators
| # | Product | Share |
|---|---|---|
| 1 | Fresh/frozen/dried fruits | Highest |
| 2 | Rice | Top 5 |
| 3 | Rubber | Top 5 |
| 4 | Fresh/frozen chicken | Top 5 |
| 5 | Cassava | Top 5 |
These 5 products = 87.7% of all agricultural exports — the risk is clear: if any single product faces problems (e.g., rubber price collapse or China stops buying cassava), farm income drops immediately.
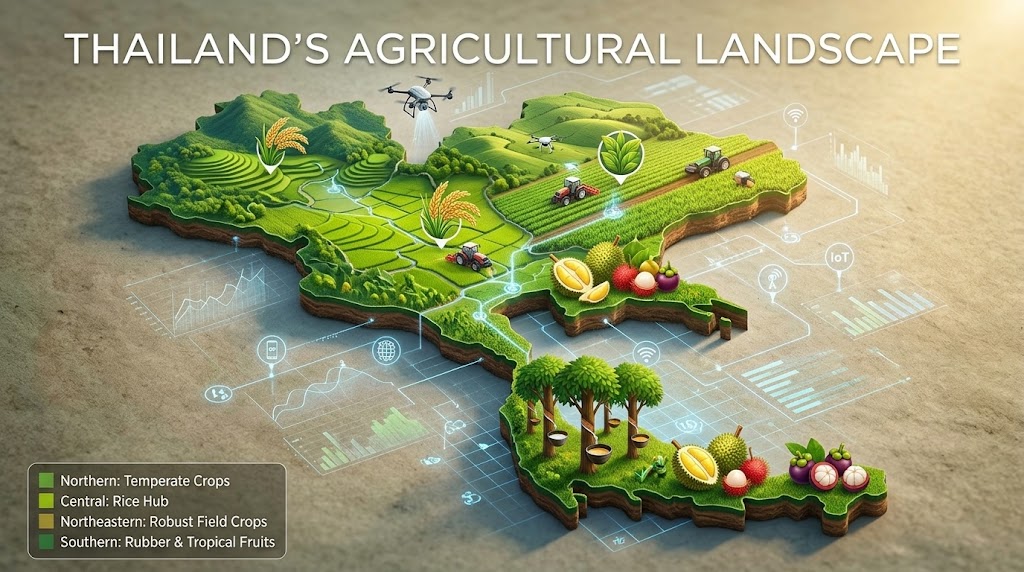
Region → Crop → Opportunity: Understanding Thai Agricultural Geography
🏔️ Northern Region: Temperate Fruits + Organic
- Main crops: Strawberries, plums, persimmons, kiwis, peaches, passion fruit
- Advantage: Valley terrain ideal for Terraced farming + temperate crops
- Opportunity: Leads in Organic & Sustainable Farming — perfect for Premium Export markets
🌾 Central Plains: Rice + Commercial Agriculture
- Main crops: Rice (primary), sugarcane, vegetables, rubber
- Advantage: Best irrigation system in the country + vast farming areas
- Opportunity: Aquaculture (shrimp, fish) + Smart Farming Scale-Up
🌵 Northeastern (Isan): Drought-Resistant + Biofuel Source
- Main crops: Glutinous rice, cassava, sugarcane, corn, pineapple, longan, coconut
- Advantage: Sandy soil, dry conditions — many crops are raw materials for government-backed biofuels
- Challenge: Poverty, youth leaving for cities, aging farmers remaining
🌴 Southern Region: Tropical Fruits + Rubber
- Main crops: Rubber, oil palm, durian, rambutan, mangosteen
- Advantage: Tropical produce fetches premium prices (especially Premium durian)
- Challenge: Frequent monsoons/floods + deforestation concerns
2024 Export Statistics: Who Buys? What’s Growing Fastest?
🌏 Main Markets (62% of exports)
| Country | Significance |
|---|---|
| China | Largest market but political risk |
| Japan | Demands Premium quality, pays premium prices |
| USA | Processed fruits, pet food |
| Malaysia | Nearby market, fast shipping |
| Indonesia | Growing rapidly |
📈 Fastest Growing Products (2024)
| Product | Growth |
|---|---|
| Seafood | +87% |
| Rubber | +37% |
| Rice | +25% |
| Spices | +23% |
| Pet Food | +23% |
🚀 Fastest Growing New Markets
- Vietnam (+79%), Senegal, Iraq, Philippines, Italy
Key Insight: New markets (Vietnam, Senegal, Iraq) grow faster than traditional large markets but require specific market intelligence — this is where data-savvy farmers gain advantage.
Agri-Tech: The Future Belongs to Those Who Adapt Fastest
Agricultural Machinery Market 2024-2026
| Factor | Impact |
|---|---|
| El Niño | Reduced yields → farmers hesitant to buy machinery |
| High household debt | Reduced purchasing power |
| New environmental standards | Pushes adoption of energy-efficient machinery |
| Economic recovery | Drives market growth in 1-3 years |
Krungsri Research Conclusion:
- Tractor manufacturers: Revenue growth from high-tech demand; strong ASEAN export demand for small-medium tractors
- SME manufacturers: High competition, must upgrade technology
- Distributors: Technology-leading brands outperform the market
🤝 Real Research Data: Why Farmers Say “Interested” But Don’t Buy?
Iconic Research conducted drone adoption research in Thailand with surprising findings:
The Discovery: Fear of Breakdown > Fear of Cost
Thai farmers (especially Central and Northeastern regions) aren’t worried about “high price” — they’re worried about “what if the machine breaks during harvest season?”
This is “Business Continuity Anxiety” — the fear that tools will disrupt operations, not the fear of spending money.
💡 What Farmers Need to Hear (Not “Saves Labor”)
| What Tech Companies Say | What Farmers Want to Hear |
|---|---|
| “Drones save 50% time” | “If the drone breaks during harvest, when will you come fix it?” |
| “AI analyzes plant leaves” | “What decision will this data help me make in the next 7 days?” |
| “Automated systems” | “Who will teach me? And who helps if I press the wrong button?” |
For KoMoMi: This is why we emphasize “full-lifecycle support systems” — not just selling equipment, but installing, training, monitoring throughout the product lifecycle.
🌱 Future Economic Crops: What’s Worth Investing In?
| Crop | Harvest Time | Uses | Market |
|---|---|---|---|
| Chili Peppers | 2-3 months | Fresh, powder, sauce | Domestic + Export |
| Kim Sung Bamboo | Fast | Shoots, fuel, aquaculture | Potential rubber replacement |
| Macadamia | 3-5 years | Nuts, oil, soap | Premium Export |
| Cocoa | 3-4 years to first harvest | 80% domestic, 20% export | Growing chocolate market |
🎯 Action Plan for Farmers: From Insight to Action
KoMoMi summarizes this into 4 steps farmers can take starting today, using insights from this report.
🟢 Step 1: Know Your Region’s Strength → Choose the Right Crops
| Region | Strength | Crops to Focus On | Crops to Avoid |
|---|---|---|---|
| North | Cool climate + Organic Premium | Strawberries, plums, kiwis | Rice (high cost) |
| Central | Good irrigation + Scale | Premium rice, shrimp, fresh vegetables | Low-water crops |
| Isan | Resilient + Biofuel demand | Cassava, sugarcane | High-water crops |
| South | Tropical + Premium fruit | Premium durian, rubber | Temperate crops |
KoMoMi helps: GeoAI Map system analyzes your farm’s soil + climate + market demand to recommend optimal crops
🟡 Step 2: Reduce “Single Market Dependency” → Build Multiple Channels
Problem: 5 products = 87.7% of exports
Solutions:
- Systematic farm data collection (IoT Sensors) → prove quality → access Premium markets requiring traceability
- Diversify sales channels → not just selling to middlemen, but online, direct to restaurants, export via GI Certification
- Crop diversification → instead of 100% rice, move to 70:30 or 60:40 ratios
KoMoMi helps: Real-time market price Dashboard + AI Forecast tells you when to sell
🟠 Step 3: Reduce Business Continuity Anxiety → Systems with Backup
From Iconic’s research: Farmers fear “equipment breaking at critical moments” more than buying expensive equipment.
KoMoMi’s approach:
- ✅ Predictive Maintenance Alerts before damage occurs
- ✅ 24/7 Support via Line Official
- ✅ Automatic data backup (data survives even if equipment fails)
- ✅ On-Premise systems work even during internet outages
- ✅ Free training throughout product lifecycle
🔴 Step 4: Prepare for Carbon Credit + ESG Standards
NESDC and the government are pushing Carbon Footprint tracking across the entire food supply chain.
This means:
- Farms that can measure Carbon = sell at premium prices
- Farms without data = forced price reductions or rejected from export markets
Timeline:
| Period | Action |
|---|---|
| Months 1-3 | Install IoT Sensors measuring energy, water, fertilizer |
| Months 3-6 | Establish farm Baseline Data |
| Months 6-12 | Adjust farming methods to reduce Carbon Footprint |
| Year 2+ | Obtain Carbon Credit certification → sell at Premium prices |
KoMoMi helps: Automatic Carbon Emission measurement and reporting with auditor-ready dashboards for banks and buyers
📊 Big Picture Summary: What’s Ahead?
| Aspect | Situation | Opportunity for Prepared Farmers |
|---|---|---|
| Exports | 52 billion USD and growing | Premium markets + Diversification |
| Technology | High-tech machinery coming | IoT/AI adopters gain advantage |
| Climate | Recurring El Niño | Smart systems handle shocks |
| Regulations | Mandatory Carbon Tracking | Data-equipped farms get premium prices |
| New Markets | Vietnam, Africa, Middle East growing | Specific data wins markets |
📄 Full Research Report (PDF)
⬇️ Download PDF: Thailand Agriculture Industry Report
🔗 References
- Iconic Research — Thailand Agriculture Industry Guide 2026 https://iconicthai.com/thailand-agriculture-industry-guide/
- Trade Policy and Strategy Office (OTPS) — Thailand Agricultural Export Analysis 2024
- Krungsri Research — Agricultural Machinery Industry Outlook 2024-2026
- Agricultural Research Development Agency (ARDA) — Economic Crops in Thailand
- NESDC — Carbon Traceability and Food Sector Report